Sorting Apples
Early Years (Age 3 – 6)
Curriculum Goal
Kindergarten: Demonstrating Literacy and Mathematics Behaviour
- Demonstrate an understanding of numbers, using concrete materials to explore and investigate counting, quantity, and number relationships (#15).
- Collect, organize, display, and interpret data to solve problems and to communicate information, and explore the concept of probability in everyday contexts (#19).
Context
- Students and the teacher begin by sitting on the floor in a circle.
Materials
- Three types of apples (e.g., red, green, yellow) cut into pieces so that every student can try each type of apple
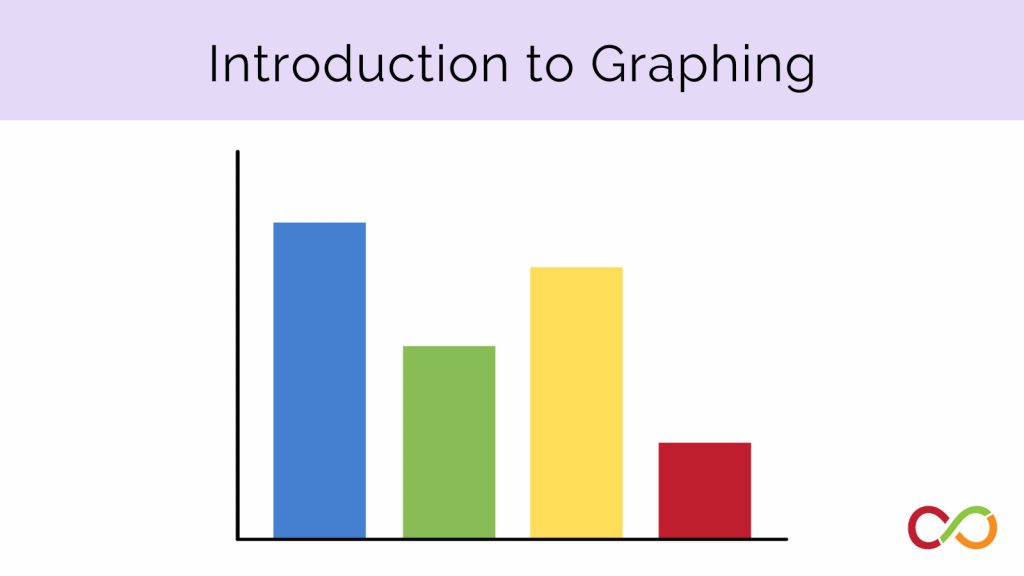
- Pre-made framework of a vertical bar graph on chart paper
- Paper apple cut outs (Appendix A)
Lesson
- Ask students to name types of apples they know.
- Hand out the pieces of apple and have the students try it.
- Ask each student to comment on how it tastes, smells, feels, and looks.
- Repeat the steps above until students have tried all 3 types of apples.
- One at a time, ask students to indicate which is their favourite apple by sticking a cut out of the apple on the graph in the appropriate column.
Look Fors
- How do children describe each type of apple (e.g., its colour, taste, feel)?
- How do they understand the relationship between the data and the graph?
- What kind of observations do children make when looking at the graph? Are they talking about which one has the most, which one has the least? Are they counting?
Extension
- The graph created in this lesson can be used in the lesson “Introduction to Graphing”.
Share this lesson
Share on facebook
Share on twitter
Share on email


