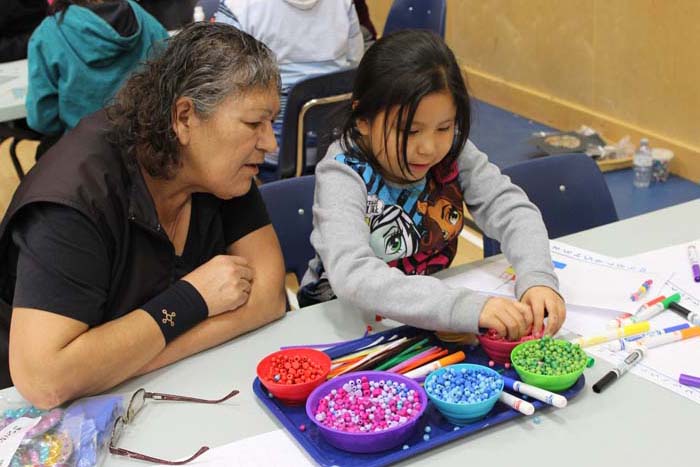
By Bev Caswell, Nora Atlookan and Jisoo Seo
To print detailed lesson plans and materials, please click here
Curriculum – Data Management and Probability
For students to sort, classify, and display a variety of concrete objects, collect data, begin to read and describe displays of data, and begin to explore the concept of probability in everyday contexts.
Materials
- Beads
- Pipe cleaner
- Pattern Beading Graph (Appendix A)
- Markers
How to play
- Take 10 or more beads of any colour.
- Put the beads through the pipe cleaner.
- Create a bar graph that corresponds to your beads
Notes
Please see the “Introduction to Graphing” lesson in the Robertson Program lesson library for more ideas on graphing in the classroom.
Language in the Activity
1 – Bezhig
2 – Niizhin
3 – Nisso
4 – Niiwin
5 – Naanan
6 – Ngodaasso
7 – Niizhaasso
8 – Nishaasso
9 – Zhaangasso
10 – Midaasso
Red – Miskwaa
Blue – Zhaawashkaa
Yellow – Ozaawaa
Pink – Bagakii-Miskwa
Green – Aniibiishi-Zhaawashkwaa
Light Purple – Zhaawashkwaa
Dark Purple – Miini-Zhaawashkwa


