Building a Graph
Early Years (Age 3 – 6)
Curriculum Goal
Kindergarten: Demonstrating Literacy and Mathematics Behaviour
- Collect, organize, display, and interpret data to solve problems and to communicate information, and explore the concept of probability in everyday contexts (#19).
Context
- Students begin by sitting in front of a whiteboard or graph paper.
- Students will have some previous experience with graphs.
Materials
- Blank sheet of chart paper
- Markers
- Ruler
Lesson
- Tell students that as a class you will be building a graph.
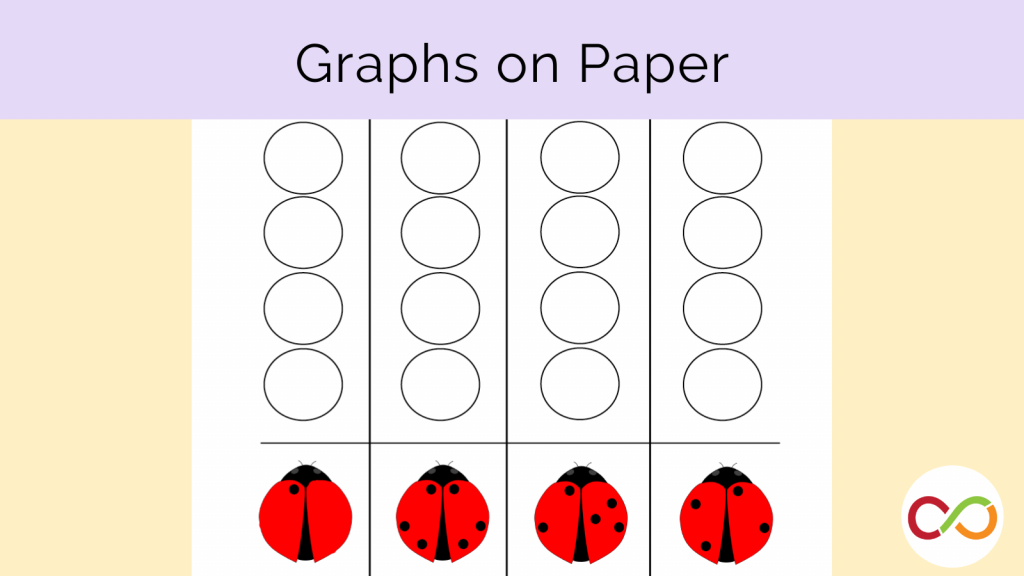
- Review the different components of a graph – title, columns, rows, and equal spacing. Don’t add the numbers just yet.
- Have children choose what the class graph should be about (e.g., favourite ice cream flavours)
- Begin to create the graph outlining and emphasizing the components of a graph.
- Once the graph is built, have each child fill in their own name to indicate their answer to the graphing question. Keep in mind that each child should fill in one spot.
- After all the children have filled in their name, ask follow-up questions that require children to use the graph to solve.
- Go through each of the options asking children how many are in each column.
- Turn students’ attention to the blank column on the far left of the graph where the numbers go.
- Ask, What could we put here to help us know more quickly how many children like chocolate best etc.?
- Fill in the numbers and now the graph is complete.
Look Fors
- Do children understand the components of the graph?
- Can students calculate the number of children in each column?
- Are children able to come up with a strategy to make the graph complete?
- What questions do children ask about the graph or what observations do they make?
Share this lesson
Share on facebook
Share on twitter
Share on email


