Card Collectors

Primary/Junior (Age 6 – 12)

Curriculum Goal

Primary: Data

  • Determine the mean and identify the mode(s), if any, for various data sets involving whole numbers, and explain what each of these measures indicates about the data 
  • Make and test predictions about the likelihood that the mean and the mode(s) of a data set will be the same for data collected from different populations 

Junior: Data

  • Determine the range as a measure of spread and the measures of central tendency for various data sets, and use this information to compare two or more data sets 
  • Determine and compare the theoretical and experimental probabilities of two independent events happening 

Context

  • Students should understand how to identify maximum and minimum numbers, the range, median, mean and mode from a data set.  

Materials

  • 15 numbered playing cards (per pair) 
  • A = 1 or 11 
  • J, Q, K = 10 
  • Jokers = wild  
  • Primary Data Collection Template (Appendix A
  • Junior Data Collection Template (Appendix B)

Lesson

Introduction: 

  • Group students into groups of two and provide each with two Data Collection Templates (Appendix A or B) and 15 numbered playing cards.  
  • Provide multiple groups with the same 15 starter cards (i.e., numeric value) to allow pairs to compare their findings once all rounds have been played.  
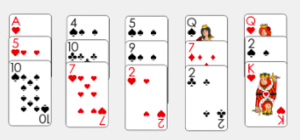
  • Ask students to organize cards into five groups of three. 
  • Student cards may be different than the ones illustrated below.
  • Tell students to decide which player will go first (e.g., whose birthday is the closest to today). 
  • The play begins with Player 1 selecting the top card from one of the five piles.
    • Only the top card of any pile can be drawn.
  • Players continue to draw one card each from the top of the piles until they collect five, six or seven cards (students choose how many they would like to have). These cards will become data sets. 
  • Students arrange their selected cards from smallest to largest. 
  • Students record the card data on their Data Collection Templates (Appendix A or B).  
  • Players independently determine the central tendencies listed. Pairs compare their data: 
Collected Data (Primary) Collected Data (Junior)
  • The highest maximum receives a point. 
  • The lowest minimum receives a point. 
  • The highest range receives a point.  
  • The lowest mode receives a point.  
  • The highest maximum receives a point. 
  • The lowest minimum receives a point.  
  • The highest median receives a point.  
  • The highest range receives a point.  
  • The lowest mode receives a point.  
  • The lowest mean receives a point. 
  • If players record the same value for any category, both receive a point.  
  • The player with the highest point count is the winner of the round.  
  • The next round can be started by players shuffling cards and organizing the cards into five new groups of three.

Conclusion: 

  • As students continue to play more rounds with the same cards, ask them to make predictions about the various forms of data they are gathering. Encourage them to analyze the data they have collected.  
    • Do you notice any similarities between rounds?  
    • What would happen if we played 10 rounds? 100 rounds? 1000 rounds? 
  • Have pairs compare their data with other pairs who received the same 15 numbered playing cards at the beginning of the game. 
    • What conclusions can you make from multiple sets of data?
    • Would your findings be different if you did not have the same cards? 
  • Ask students why collecting data is important and how it influences their own lives. 

Look Fors

  • Are students considering the minimums and maximums while selecting cards and thinking about the range, mean, and median?  
  • What do students notice as they compare their data with other groups? 
  • What mathematical language are students using to describe data and findings?  

Extension

  • Ask students to collect an even number of cards. This specification will require players to calculate the median.  
  • Further challenge students by increasing the deck size from 15 cards and the number of cards players can draw. For example, instead of playing with 15 cards, students could be provided with 35 cards and arrange the cards into seven groups of five.  
  • Tell students that playing cards can be played as multiples of 10 (e.g., 7 becomes 70) to limit mental math work with decimals if necessary.   
  • Ask students to determine the minimum, maximum, range, mode, mean, and median of their 15 starter cards and compare the values with their individual data sets. Discuss the differences between the original and chosen data sets. 
    • For instance, the maximum/minimum of the original data set with 15 cards may or may not be different from a student’s chosen data set with 5-7 cards. 

Share this lesson

Share on facebook
Share on twitter
Share on email