
Chain Game: Simulating the World Market
Junior (Age 9 – 12)
Curriculum Goal
Junior: Number Sense
- Represent and solve problems involving the addition and subtraction of whole numbers and decimal numbers, using estimation and algorithms.
Junior: Data Management
- Select from among a variety of graphs the type of graph best suited to represent various sets of data; display the data in the graphs with proper sources, titles, and labels, and appropriate scales; and justify their choice of graphs.
- Determine the mean and the median and identify the mode(s), if any, for various data sets involving whole numbers, and explain what each of these measures indicates about the data.
- Analyze different sets of data presented in various ways by asking and answering questions about the data.
- Draw conclusions and make convincing arguments, informed decisions.
Junior: Financial Literacy
- Estimate and calculate the cost of transactions involving multiple items priced in whole-dollar amounts (not including sales tax) and the amount of change required when payment is made in cash, using mental math.
Context
- Students will be divided into five groups for this whole-class simulation activity.
Materials
For teacher/facilitators
- 5 staplers + extra staples
- Stopwatch
- Bell
- Calculator
- Banker tally chart (Appendix A)
- Optional: play money to remunerate each group for paper chains
For students
- 5 large envelopes (for materials)
- 36 sheets of newspaper
- 10 sheets of coloured paper
- 10 pairs of scissors
- 10 glue sticks
- 9 pencils
- 8 metric rulers
Distribution of Materials
Group A
| Group B
|
Group C
| Group D
|
Group E
|
Lesson
- Explain that students will be divided into five groups to produce paper chains for “The World Bank” in a simulation of the global economy. Rules:
- Each link must be made from a strip of newspaper exactly 20 cm long and 3 cm wide.
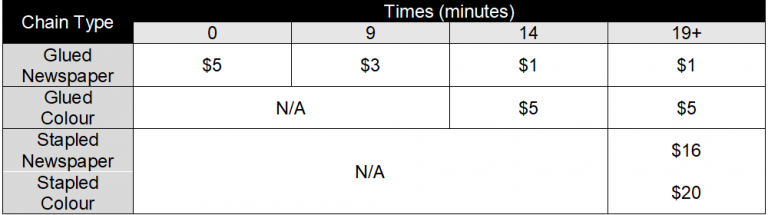
- Each three-link chain can be sold to the banker (teacher) for five currency units.
- There will be quality control. Poorly constructed chains will not be accepted.
- Resources (including raw materials, technology, and labour) can be traded or bought as production continues. A leader within each group will record these transactions.
- Simulations can sometimes evoke emotions. Students should be attuned to their feelings so that they can be shared in the debrief.
- Distribute the envelopes with materials to each group.
- Allow students to begin chain-making. At the following times, ring the bell and make the announcement. Students should be kept unaware of the upcoming price fluctuations.
- 9 minutes: price drop to 3 currency units per chain.
- 14 minutes: price drop to 1 currency unit per chain. Introduce demand for colour paper chains at 5 currency units per chain.
- 19 minutes: a new technology – staplers – is available for purchase at 35 units of currency. Stapled chains will receive the current market price, plus an additional 15 units of currency (16 units/newspaper, 20 units/colour paper).
- 23 minutes: chain-making concludes in two minutes.
- 25 minutes: chain-making concludes. Any remaining chains may be sold to the bank.
- Invite students to discuss feelings that arose during the simulation and probe the issues revealed by the mathematics of the various exchanges. The following questions are modeled from Susan Fountain’s book, Education for Development: A Teacher’s Resource for Global Learning (UNICEF, 1995).
- What did it feel like to open your envelope and realize you were starting at a disadvantage? How did you deal with things being unfair?
- Which group earned the most money and which group earned the least? What was the difference between the lowest and highest earning groups?
- (How) did this difference relate to their starting or ongoing resources? Graph the relationship between resources and earnings.
- What was the average (mean) earning? How far did groups deviate from that mean?
- By what percentage did the earnings of the highest earning group exceed those of the lowest earning group?
- On average, how many chains were produced in a minute without staplers? How many were produced in a minute with staplers? By what factor did the new technology increase production? By what factor did the new technology increase profits?
- What sorts of trades were negotiated? What happened when you did not have resources to trade?
- Were any cooperative arrangements made between groups?
- What kinds of inter-dependencies or divisions of labour were worked out within groups?
- What was the effect on wealthier groups of the falling world market price for chains? For poorer groups?
- Which groups were able to purchase new technology? Did the new technology help all groups? (Or did the development of new technology allow wealthy groups to get wealthier, while poorer groups got poorer?)
- When your chain was worth less and you got paid less, what happened in your group? Did you work harder to make as much money?
- Identify the social justice focus of the game or any real-life connections.
Related Lessons
Analyze and graph data related to food inequity within Canada.
Share this lesson
Share on facebook
Share on twitter
Share on email