Kindergarten: Demonstrating Literacy and Mathematics Behaviour
Collect, organize, display, and interpret data to solve problems and to communicate information, and explore the concept of probability in everyday contexts (#19).
Context
Students begin by sitting in a circle. Students will move to tables to work on their circle and bar graph.
Show students the circle graph and explain that this is another way to display information.
Have students go to different tables and work on translating the circle graph into a bar graph.
The last page of the circle to bar graph package will have questions about the graph. For example: How many more squares did you have than triangles?
When students finish filling in the graphs, they can practice asking each other questions about the graph.
Look Fors
Can children translate the information from the circle graph onto a bar graph?
Are children able to come up with questions about the information in the bar graphs to ask other students?
Extension
Tooth graph: a magnet with each student’s name on it can be used to represent who has lost a tooth. As a child loses a tooth, they can update the graph.
Circle weather graph (works best in the month of November, when Canada typically observes the most diverse weather): put a daily mark in the appropriate weather section and have students predict which type of weather they will get the most.
Siblings graph: ask students how many siblings they have and have them put their mark in the appropriate section.
Related Lessons
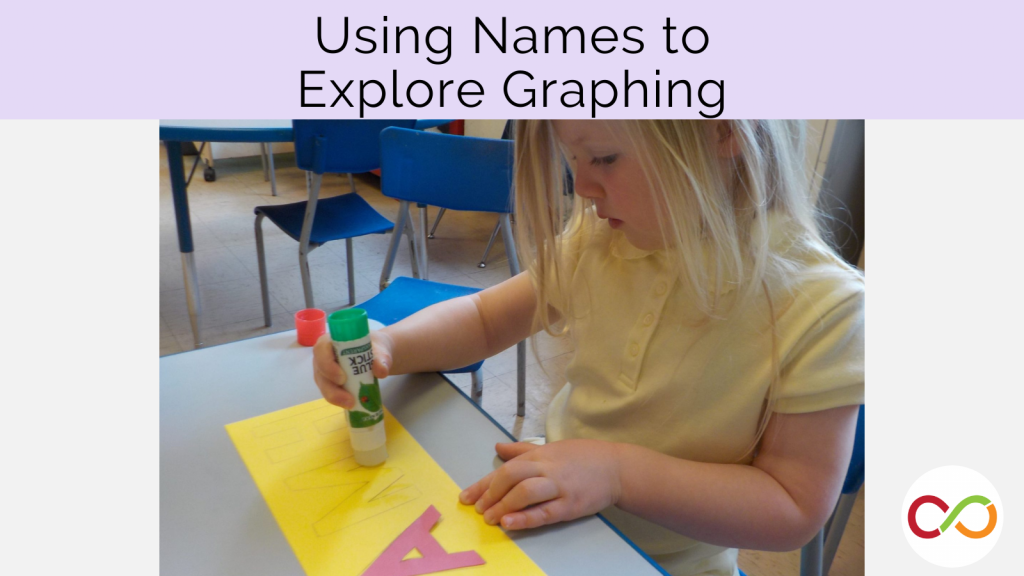
Prior to Circle to Bar Graph: An introductory activity to get students thinking about sorting and learning about graphs which may support student learning in this lesson.
Shares curriculum expectations: Collect, organize, display, and interpret data to solve problems and to communicate information, and explore the concept of probability in everyday contexts (#19).